

Bitcoin Hits $80K as Bull Signals Strengthen
Bitcoin Just Did Something It Hasn’t Done in Nearly a Year — Here’s What Actually Matters
Bitcoin’s up 24% since mid-August. That’s not a typo.
Table Of Content
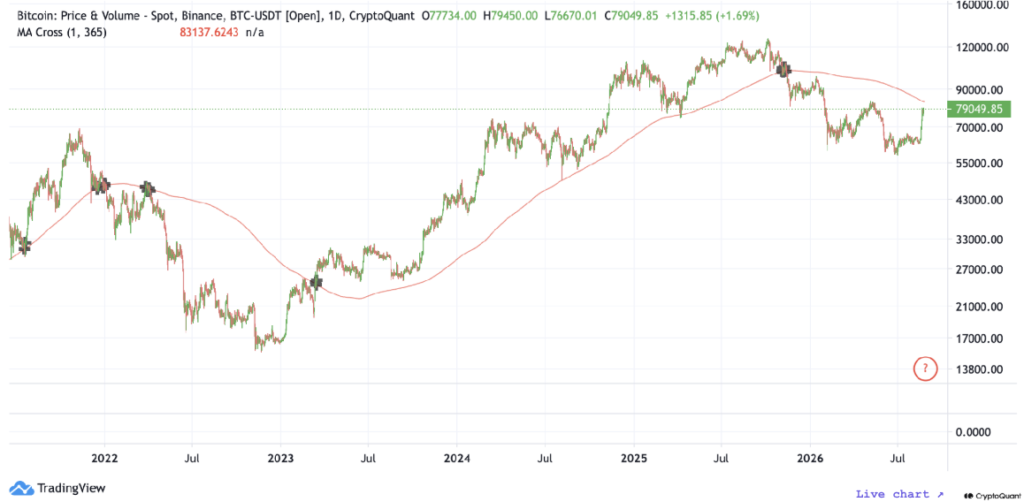
We went from low-60s to touching $80K in less than a month, and the move’s caught a lot of people off guard. If you’ve been watching crypto Twitter, you’ve seen the usual chaos: moonboys screaming validation, permabears insisting it’s a bull trap, and everyone pretending they called it.
But here’s what actually happened, what the data’s saying, and the one thing that needs to happen before I’m comfortable calling this a proper bull run.
What Sparked This Bitcoin Rally?
Two things converged at basically the same time, and they’re both a bit weird if you’re not deep in the macro weeds.
First, the U.S. Treasury announced they’re doing bond buybacks. I know, sounds boring as hell, but stay with me. When the government buys back its own bonds, it injects liquidity into the system. More cash floating around means investors go hunting for places to put it. Bitcoin’s become one of those places, especially when traditional assets look shaky.
Second, Trump opened his mouth about Bitcoin again. Specifically, he floated the idea that the U.S. should be buying Bitcoin as a strategic reserve. Now, I’ve heard this song before. Politicians love crypto when polls say voters do. But the market doesn’t care about my cynicism — it reacted, and it reacted hard.
The thing is, both of these catalysts hit at a moment when Bitcoin was already coiled. The technicals were setting up, demand was quietly building, and sentiment had finally washed out after months of sideways grinding.
Sometimes timing really is everything.
The CryptoQuant Bull Score Flipped Hard
If you’re not familiar with CryptoQuant’s Bull Score, it’s basically a composite indicator that tracks 10 different on-chain and market signals. It ranges from 0 (extremely bearish) to 100 (extremely bullish).
A week ago, it was sitting at 30. Meh territory. Not catastrophic, but definitely not exciting.
Then it jumped to 80 in seven days.
That’s the most bullish reading we’ve seen in nearly a year. Eight out of ten signals are now flashing green. For context, the last time we saw this kind of flip, Bitcoin went on a sustained run that added another 30% over the following months.
I’m not saying history repeats exactly. But this indicator doesn’t flip like this on noise. It measures real things: exchange flows, miner behavior, long-term holder accumulation, funding rates, and open interest dynamics. When all of those align bullish at once, it’s worth paying attention.
Honestly? I was skeptical when I first saw it. Felt too fast. But when I dug into the underlying signals, they’re legitimate. This isn’t just price going up and indicators following — the demand structure actually shifted.
Spot and Futures Buying Are Finally Moving Together
Here’s the part that got my attention more than anything else.
For months, we’ve had this weird pattern where spot demand would tick up but futures stayed flat, or vice versa. It’s like the market couldn’t decide if it actually wanted to commit. That kind of divergence usually leads to chop, not trends.
But right now, both spot volumes and futures open interest are expanding together. That hasn’t happened since October of last year. And when you look at historical data, that combination — genuine spot buying paired with leveraged traders adding positions in the same direction — tends to fuel sustained moves.
It’s not a guarantee. Nothing ever is. But it’s one of those setups where the odds tilt in your favor if you’re positioned right.
The spot ETFs have been seeing consistent inflows too. Not record-breaking, but steady. That institutional money tends to be stickier than retail FOMO, which is a good sign if you’re thinking medium-term.
The One Level Bitcoin Needs to Reclaim
Here’s the catch, and it’s a big one.
Bitcoin’s 365-day moving average is sitting right around $83,000. We’re currently about 5% below it.
If that number sounds arbitrary, it’s not. The yearly moving average has acted as the dividing line in basically every Bitcoin cycle. When price is above it and holding, we’re in a bull market. When price is below it and can’t break back above, we’re either in a bear or stuck in purgatory.
Right now, we’re knocking on the door. We’ve had a couple of wicks above $80K, but we haven’t closed a daily candle convincingly above that $83K zone.
Until we do, I’m treating this as a strong relief rally inside a larger range. Could it turn into more? Absolutely. The setup’s there. But that moving average is the line in the sand, and the market knows it.
I’ve been burned before getting too excited about moves that fail right at key moving averages. Back in 2019, Bitcoin rallied from $3K to $14K and everyone thought we were off to the races. Then it smacked into the yearly MA, rolled over, and we spent another year grinding sideways.
Not saying that happens here. The macro backdrop’s different, on-chain data’s more supportive, and we’ve got actual catalysts this time. But I’m not popping champagne until we’re clearly above that level.
What to Expect in the Near Term
Look, you’re going to see some chop.
After a 24% move in three weeks, Bitcoin doesn’t just go straight up forever (despite what your favorite CT influencer might suggest). We need to digest these gains, let late shorts cover, let early longs take profit, and see if new buyers are willing to step in at higher prices.
I’d expect some back-and-fill between $76K and $82K over the next week or two. Maybe we take another run at $83K, maybe we dip back to scare people first. The market loves to make both bulls and bears uncomfortable before it commits to a direction.
The key thing to watch is whether the spot and futures demand stays healthy during any pullback. If we dip 5-8% and volumes collapse, that’s a red flag. If we dip and buyers show up aggressively, that’s your confirmation this move has legs.
Also keep an eye on macro. The Treasury bond buyback program is scheduled to continue, which is supportive. But if we get surprise inflation data or the Fed starts making hawkish noises again, risk assets across the board will get hit. Bitcoin’s not immune to that, no matter how bullish the on-chain data looks.
My Take: Cautiously Optimistic, Not Euphoric
I’ve been trading and writing about Bitcoin since 2016. I’ve seen rallies that felt incredible melt into nothing, and I’ve seen setups that looked sketchy turn into generational moves.
This one feels different than the garbage rallies we saw in 2023 and early 2024. The demand structure’s healthier, the catalysts are real (even if Trump’s probably full of it), and the technical picture’s finally cooperating.
But I’m not going full degen long here. Not yet. Give me a weekly close above $83K, and I’ll get more interested. Give me a retest of that level that holds, and I’ll probably add to positions.
Until then, this is a “stay long but manage your risk” environment. Stop losses matter. Position sizing matters. Not getting caught up in the hype matters.
Most people I talk to are either completely euphoric already or still totally bearish. Neither extreme is helpful. The truth’s somewhere in the middle: Bitcoin’s in a much better spot than it was a month ago, but it still has work to do before you can call this a confirmed bull market.
FAQ
Is Bitcoin going to $100K this year?
Could it? Sure. The path’s theoretically there if we break above the yearly moving average and momentum stays strong. But anyone giving you a confident timeline is guessing. Watch the $83K level first.
Should I buy Bitcoin right now?
I’m not your financial advisor, but if you’re asking me what I’d do? I’d wait for either a pullback to $76K-$77K or a clean break above $83K. Chasing after a 24% move rarely works out well.
What’s the deal with Trump and Bitcoin reserves?
It’s political posturing until it’s not. Could the U.S. eventually hold Bitcoin as a strategic asset? Maybe. Is it happening tomorrow? Probably not. But markets price in possibilities, not certainties.
Why does the 365-day moving average matter so much?
Because it’s acted as the bull/bear dividing line in every Bitcoin cycle. It’s not magic, but enough traders and institutions watch it that it becomes a self-fulfilling level. Break above it convincingly, and sentiment shifts.
Is this rally different from the fake-outs we’ve seen before?
The on-chain data’s more supportive this time, with spot and futures demand aligning. But we’ve still got that $83K hurdle to clear. Different doesn’t mean guaranteed — it means the odds are better.
What happens if Bitcoin can’t break $83K?
We probably range between $72K and $82K for another few months. Not the worst outcome, honestly. Gives the market time to build a base and shake out weak hands.
Are the spot ETFs still buying Bitcoin?
Yes, inflows have been steady over the past few weeks. Not record-breaking, but consistent. That institutional demand tends to provide a floor, which is healthier than retail FOMO alone.